Sudoor Manthan- IIRS Science Portal
The North Indian Ocean (NIO) is one of the most significant cyclone-producing basins in the world, playing a crucial role in regional climate and weather extremes. It consists of two major cyclone basins: the Bay of Bengal (BoB) located on the eastern side of India and the Arabian Sea located on the western side. Although it contributes only about 6% of the global tropical cyclone formation, it consistently generates high-impact tropical cyclones. These cyclones are particularly significant because they frequently make landfall along densely populated coastlines of India, Bangladesh, Myanmar, Sri Lanka, and Oman, leading to major socio-economic and environmental impacts.
The NIO has two main seasons when most tropical cyclones form (Figure 1a). The first is the pre-monsoon season (April to June), when the sea becomes warm and wind conditions are calm enough to support cyclone development. The second, and usually the more active period, is the post-monsoon season (October to December), when the monsoon withdraws and the atmosphere again becomes favourable for cyclones, especially over the Bay of Bengal. During the monsoon months of July to September, strong winds in the upper atmosphere prevent cyclone formation, so very few storms form in this period. During the 30-year period from 1996 to 2025, a total of 266 cyclonic disturbances were recorded over the NIO, comprising different intensity categories: Depression (D: 74), Deep Depression (DD: 65), Cyclonic Storm (CS: 48), Severe Cyclonic Storm (SCS: 31), Very Severe Cyclonic Storm (VSCS: 26), Extremely Severe Cyclonic Storm (ESCS: 18), and Super Cyclonic Storm (SuCS: 4) (Figure 1b).
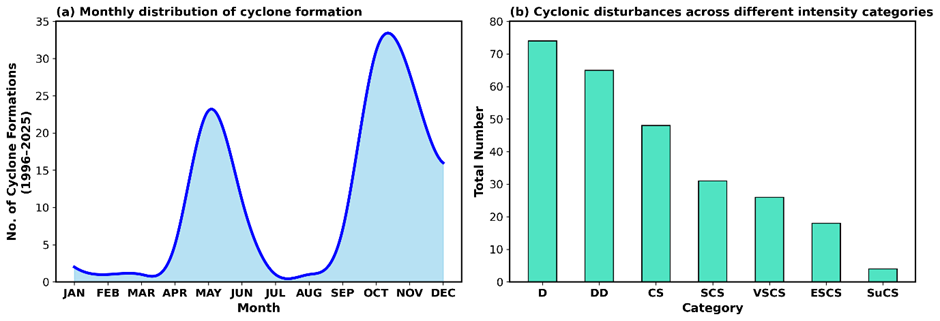
Figure 1: (a) Seasonal distribution of tropical cyclone formation and (b) frequency of cyclonic disturbances across different intensity categories over the North Indian Ocean during 1996–2025
Figure 2a illustrates the interannual variation in tropical cyclone formation over the NIO during the 30-year period from 1996 to 2025. The analysis indicates that the basin experiences an average of approximately four tropical cyclones annually. However, certain years exhibited enhanced cyclone activity, such as 1998, 2000, 2010, 2013, 2018, 2019, and 2023, whereas comparatively lower cyclone activity was observed during 2011 and 2012. The highest cyclone frequency was recorded in 2019 with eight cyclones, followed by seven cyclones in 2018. The figure highlights several years with enhanced cyclone activity as well as years with comparatively suppressed cyclone formation, reflecting the impact of ocean–atmosphere variability on cyclone genesis over the NIO.
Figure 2b presents a comparative distribution of tropical cyclone formation over the BoB and the Arabian Sea. The results clearly demonstrate the dominance of the BoB in terms of cyclone frequency throughout the study period. Nevertheless, the Arabian Sea also contributed significantly during certain years, particularly 1998, 2001, 2004, 2014 and 2015 with enhanced cyclone activity observed during 2018-2019. The BoB produces more cyclones than the Arabian Sea because its ocean and atmospheric conditions are much more favourable for storm formation. The BoB is warmer throughout the year, and warm water is the main energy source for cyclones. In addition, the BoB receives large amounts of fresh water from major rivers like the Ganga, Brahmaputra, and Irrawaddy, creating a warm, low-salinity layer on the surface that helps storms intensify quickly. The wind patterns are also more supportive in the Bay of Bengal, with lower vertical wind shear compared to the Arabian Sea, allowing storms to grow without being disrupted. The monsoon also plays a role by helping to trigger low-pressure systems more frequently over the Bay. As a result, the combination of warm water, favourable winds, and frequent weather disturbances makes the Bay of Bengal much more active for cyclone formation than the Arabian Sea.
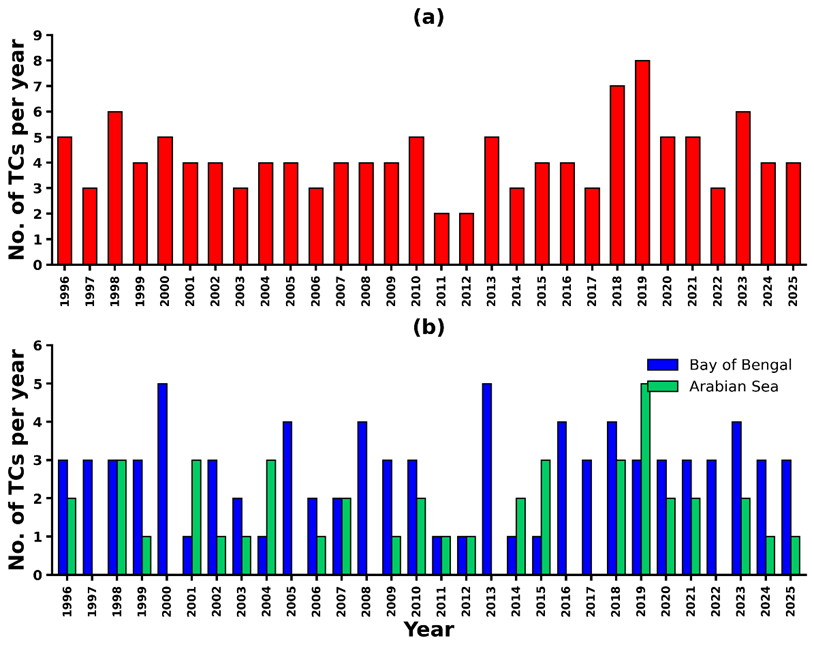
Figure 2: Year-wise distribution of tropical cyclones formed over the (a) North Indian Ocean (NIO) and (b) its two sub-basins, namely the Bay of Bengal and the Arabian Sea, during 1996–2025.
The interannual variability and linear trend in tropical cyclone frequency over the NIO during 1996–2025 are shown in Figure 3. Cyclone frequency ranged from approximately 2 to 8 cyclones per year. The positive linear trend suggests that tropical cyclone activity over the NIO has shown a slight increasing tendency during recent decades. However, the magnitude of the trend is relatively low, suggesting that cyclone frequency has remained largely stable with only a marginal long-term increase.
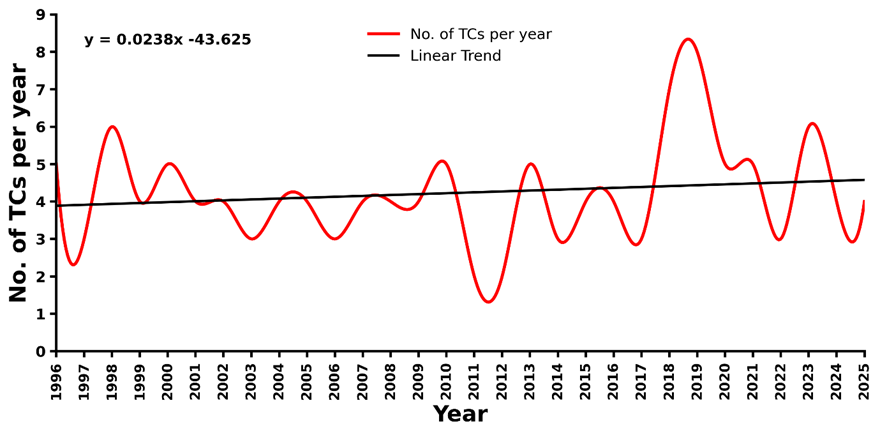
Figure 3: Interannual variability and linear trend of tropical cyclone frequency over the North Indian Ocean during 1996–2025.
Bibilography
Singh, K., Panda, J., & Mohapatra, M. (2020). Robustness of best track data and associated cyclone activity over the North Indian Ocean region during and prior to satellite era. Journal of Earth System Science, 129(1), 84.
Singh, V. K., & Roxy, M. K. (2022). A review of ocean–atmosphere interactions during tropical cyclones in the North Indian Ocean. Earth-Science Reviews, 226, 103967.