
Sudoor Manthan- IIRS Science Portal
Diagnostic absorption spectroscopy across the Visible, Near-Infrared, and Shortwave Infrared (VNIR–SWIR: 0.4–2.5 µm) regimes enables rapid, non-destructive chemical and mineralogical characterization of lithological units. In this investigation, airborne imaging spectrometer data from AVIRIS-NG were integrated with laboratory-based spectroradiometric measurements to map and discriminate limestone sub-types within the metasedimentary sequences of the Kalinjara Formation, Aravalli Supergroup. By quantifying diagnostic absorption band parameters—specifically band depth (BD), wavelength position, and band asymmetry near 2.20–2.22 µm and 2.33–2.34 µm—we demonstrate that subtle spectral variations directly resolve intra-deposit purity and silica/alumina impurity distributions, providing an operational remote-sensing framework for high-precision deposit evaluation.
Spectroscopy evaluates the wavelength-dependent interaction of electromagnetic radiation with atomic and molecular structures. In rock-forming minerals, absorption, reflection, and scattering phenomena are governed by discrete quantum transitions, including electronic crystal-field interactions, inter-band charge transfers, and molecular vibrational stretching and bending modes. The resulting spectral profiles exhibit diagnostic absorption bands that serve as unique compositional signatures (Figure 1).
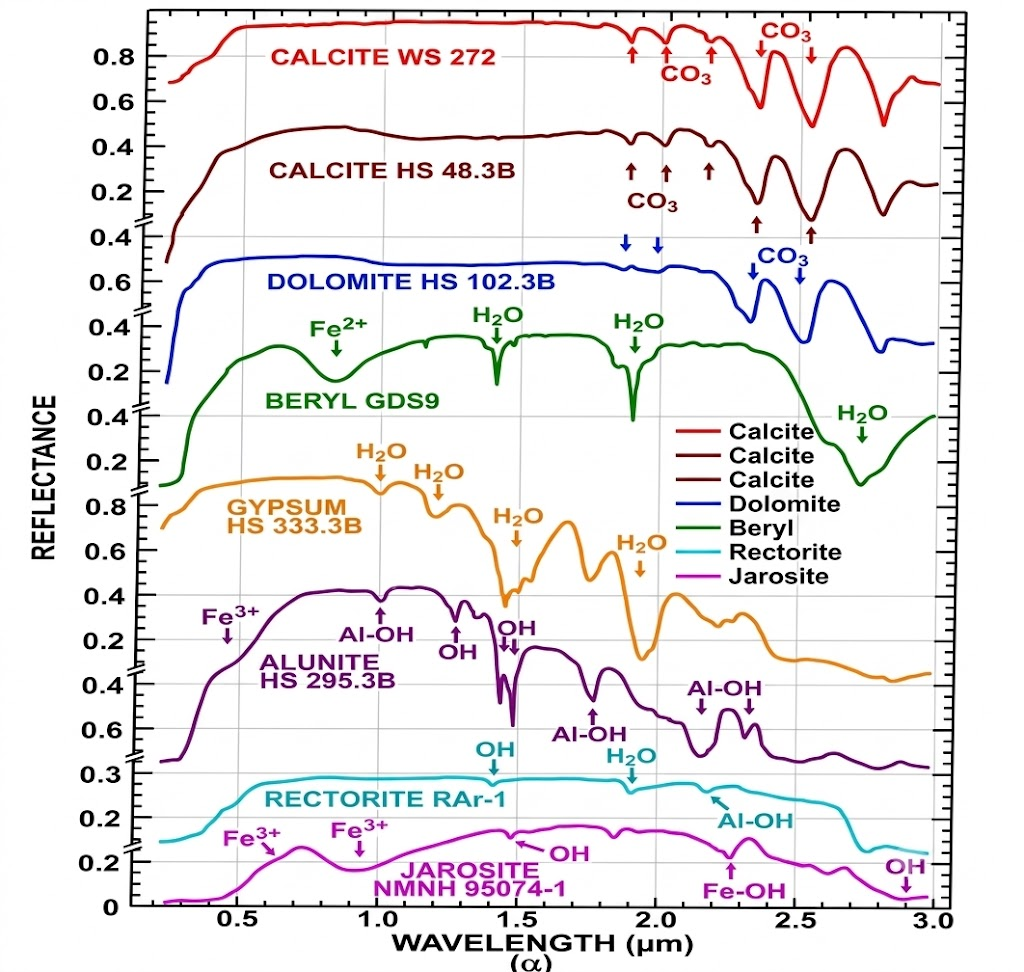
Figure 1: : Stacked spectral reflectance curves of selected rock forming reference minerals (calcite, dolomite, beryl, gypsum, alunite, rectorite, and jarosite) across the 0.2 to 3.0 µm wavelength range, highlighting the primary diagnostic electronic and vibrational absorption features. These include transitions caused by iron (Fe²⁺, Fe³⁺), molecular water (H₂O), structural hydroxyl (OH), metal-hydroxyl complexes (Al-OH, Fe-OH), and carbonate (CO₃), Source: Modified after Clark , 1999
In carbonate-bearing sedimentary and metasedimentary rocks, reflectance spectra are governed primarily by fundamental vibrational modes and overtone/combination bands of the planar carbonate radical (CO₃²⁻), producing prominent diagnostic features between 2.30 and 2.35 µm ( ₁ + ₃combinations). When secondary phyllosilicates or detrital phases are present, hydroxyl-bearing bonds specifically Al-OH and Mg-OH complexes introduce auxiliary absorption doublets and shoulders in the 2.20–2.22 µm regime. High-fidelity imaging spectrometers, such as the Airborne Visible/Infrared Imaging Spectrometer-Next Generation (AVIRIS-NG), resolve these fine absorption metrics, bridging laboratory spectroradiometry and regional lithological exploration.
The investigation was conducted in the southern continuation of the Partipura Mines (India Cements Ltd.) near Nokla Village, Banswara District, southern Rajasthan Figure 2. The study area, stratigraphically, falls within the Lunavada Group of the Aravalli Supergroup consisting of phyllite, metagreywacke, mica schist, dolomite, dolomitic marble, and amphibole schists (after GSI, 2000). The area is dominated by the metasediments of the Kalinjara Formation, principally comprising recrystallized dolomite, limestone, phyllite, and quartzite.
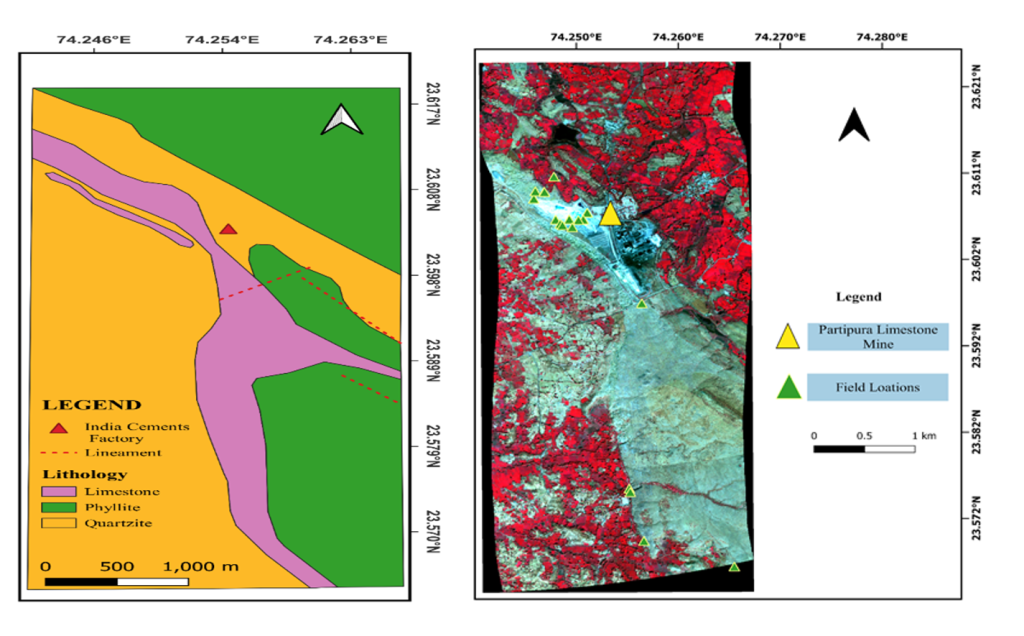
Figure 2: Regional lithostratigraphic map of the study area showing metasedimentary units of the Kalinjara Formation (Lunavada Group, Aravalli Supergroup) and systematic field sampling locations south of the Partipura Mines.
Spectral Analysis
Detailed spectral deconvolution was conducted across the 2.0–2.5 µm SWIR window, evaluating relative band depth, center position, and band asymmetry against reference USGS spectral libraries (Figure 3). Two spectrally and compositionally discrete limestone varieties were identified:
Diagnostic Carbonate Triplet: Both classes display pronounced carbonate absorption minima between 2334 nm and 2339 nm, confirming calcite as the primary mineral constituent.
Impurity-Driven SWIR Absorption: A secondary, highly diagnostic feature emerges between 2204 nm and 2219 nm, directly corresponding to Al-OH vibrational combination bands associated with fine-grained phyllosilicates (e.g., illite/kaolinite-smectite phases).
Band Depth Metrics:
Limestone Type-I: Exhibits a shallow absorption depth (BD = 0.0956) at 2204 nm.
Limestone Type-II: Exhibits a pronounced, deep absorption band (BD = 0.1854) across 2204–2219 nm.
Asymmetry: Both classes show slightly positive asymmetry, indicating spectral skewness toward longer wavelengths characteristic of coupled structural bonding.
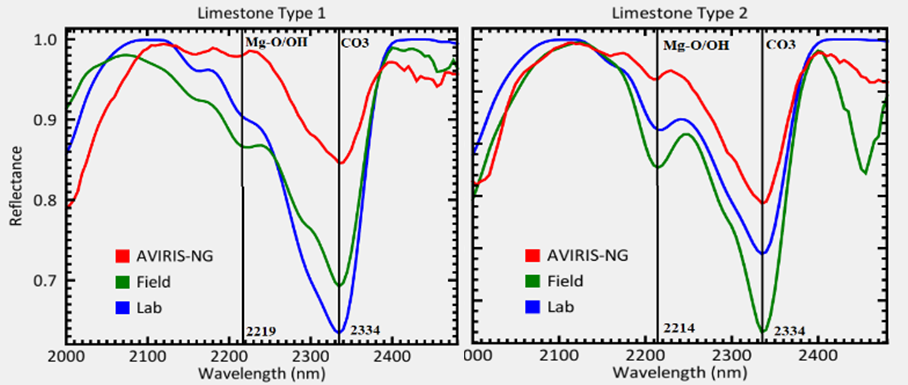
Figure 3: Continuum-removed SWIR reflectance spectra of Limestone Type-1 and Type-2. The diagnostic CO₃²⁻ absorption minimum is centred at 2334–2339 nm, while the secondary Al-OH impurity feature occurs at 2204–2219 nm with distinct band depth variations.
Geochemical Correlation and Validation
The observed differences in SWIR absorption depth correlate with trace geochemical and mineralogical impurity variations confirmed through compositional analysis using Gamma Ray spectroscopy:
| Chemical Constituent | Limestone Type-I (wt. %) | Limestone Type-II (wt. %) |
| CaO | 48.786 | 44.069 |
| SiO₂ | 9.126 | 16.167 |
| Al₂O₃ | 0.507 | 1.108 |
| Fe₂O₃ | 0.424 | 0.655 |
| MgO | 1.330 | 1.281 |
Silica & Alumina Enrichment: Type-II limestone exhibits a roughly twofold increase in Al₂O₃ (1.108% vs. 0.507%) and a marked elevation in SiO₂ (16.167% vs. 9.126%) relative to Type-I. The deeper 2.219 µm absorption feature tracks this elevated alumina and silica content.
Al³⁺ / Mg²⁺ Structural Ratio: The calculated Al³⁺ / Mg²⁺ ratio shifts from 0.38 in Type-I to 0.86 in Type-II. This structural shift corresponds to subtle macroscopic color variations observed in outcrop exposures (Type-II exhibiting a pale pinkish cast) and aligns with regional gamma-ray spectroscopic surveys.
Matrix Stability: The relative stability of the primary 2334–2339 nm carbonate band center across both varieties is consistent with the sustained, dominant CaO matrix (44.07–48.79 wt. %).
Summary and Industrial Implications
These results establish that sub-pixel spectral absorption metrics directly correlate with minor geochemical and lithological impurities in crystalline carbonate deposits. By monitoring diagnostic band depths near 2200–2220 nm alongside primary carbonate absorption bands, imaging spectrometers can delineate high-grade metallurgical/cement-grade limestone (Type-I) from lower-grade, silica/alumina-rich varieties (Type-II).
This methodology eliminates the need for extensive initial chemical wet-assays during preliminary reconnaissance, highlighting the role of hyperspectral remote sensing—both from airborne platforms like AVIRIS-NG and future satellite-borne payloads—in automated grade evaluation and natural resource management across India’s mineral belts.
References
Rohta A., Sharma, R. U.,Chattoraj, S. L, 2025, Lithological Discrimination of Parts of the Bhukia Area, Banswara District, Rajasthan Using Hyperspectral Data, Journal of the Indian Society of Remote Sensing (2025) 53:361–371 https://doi.org/10.1007/s12524-024-01955-6
Rani, K., Guha, A., Kumar, K. V., Bhattacharya, B. K., & Pradeep, B. (2020). Potential use of airborne hyperspectral AVIRIS-NG data for mapping proterozoic metasediments in Banswara, India. Journal of the Geological Society of India, 95(2), 152–158.
Chattoraj, S. L., Sharma, R. U., Kumar, C., & Sengar, V. (2020). Identification and characterization of hydrothermally altered minerals using surface and space-based reflectance spectroscopy, in parts of south-eastern Rajasthan, India. SN Applied Sciences, 2(4), 1–9
Jain, R., & Sharma, R. U. (2019). Airborne hyperspectral data for mineral mapping in Southeastern Rajasthan, India. International Journal of Applied Earth Observation and Geoinformation, 81, 137–145.
Kruse, F. A., Boardman, J. W., & Huntington, J. F. (2003). Comparison of airborne hyperspectral data and EO-1 Hyperion for mineral mapping. IEEE Trans Geoscience and Remote Sensing, 41(6), 1388–1400.
Van Der Meer, F. (2004). Analysis of spectral absorption features in hyperspectral imagery. International Journal of Applied Earth Observation and Geoinformation, 5(1), 55–68
Geological Survey of India (2000). District Resources of Banswara, Rajasthan.
Clark, R. N. (1999). Spectroscopy of rocks and minerals, and principles of spectroscopy. Man Remote Sens, 3(3–58), 2–2
Hunt, G. R. (1977). Spectral signatures of particulate minerals in the visible and near-infrared. Geophysics, 42, 501–513.