
Sudoor Manthan- IIRS Science Portal
The growth of the kharif crops are observed in the current growing season. There is focus on crop diversification under the centre’s major initiatives with the ICAR, with financial incentives to conserve the ground water table which is depleting at an alarming rate. The peak growing phases is effectively picked up by S-band (3.2 GHz, 9.4 cm wavelength) NISAR data- in systematic coverage of 240 km swath at 10m resolution achieving the high resolution at larger swath utilizing the SWEEPSAR technique first time globally. Here GCOV- L2 product dual-pol data was processed and HH stack is used here for further analysis.
The C3- crops dominantly paddy and kharif pulses fields corresponding to the bright cyan- blue colour in the FCC as contrast to the stable pinkish signature for the C4 crop zones, dominantly sugarcane belt. C3 crops generally thrive in mild and humid temperature associated with first stable 3-carbon compound (3-phosphoglycerate (3-PGA), in contrast to the C4 crops that genarally thrive well in hot and dry climate with first stable 4-carbon compound Produces a 4-carbon compound called oxaloacetate (which converts to malate). C4 crops are more water efficient and has minimal photo-respiration thus thrives best in hotter regions and are climate resilient.
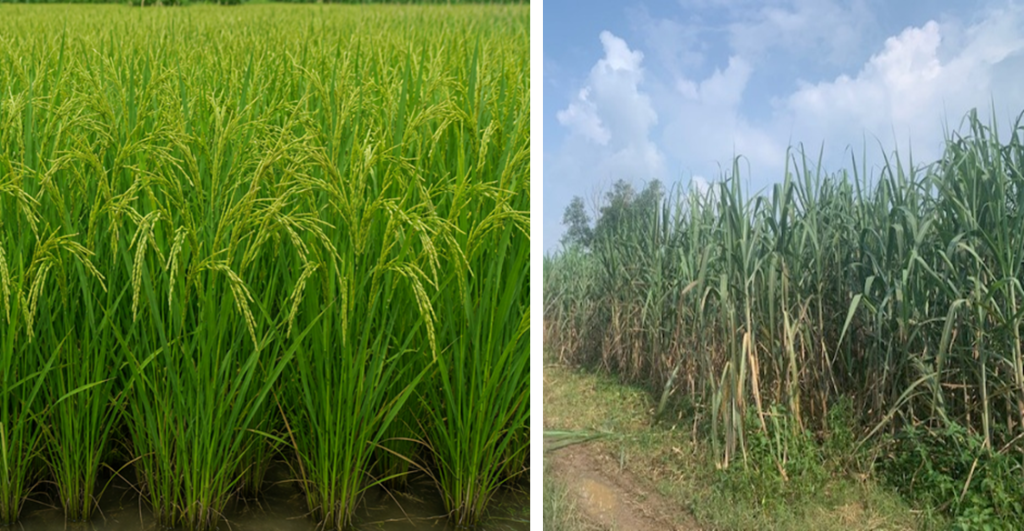
Figure 1 – Heading stage in rice and peak tillering stage in sugarcane in study area.
The study area was selectedThe river acts as a line of divide in the crop sequence – Prussian blue in July- August-Sept data. Three date SAR data temporal FCC is shown in Fig.2. High soil moisture in July is depicted in the sugarcane fields where the crop height is less and soil signature dominates, subsequently overridden by significant crop growth during August and September leading to the pinkish tone. In contrast in the C3 stagnant water invariably occurs in July and subsequent increase in backscatter as the crop grows. The spectacular contrast on both the sides of river is picked up due to higher penetration as compared to C-band (fig3) where flatter tones were observed. The sugarcane signature is supported by Maize dominant area also. Thus the findings can be generalized for C4 crops.
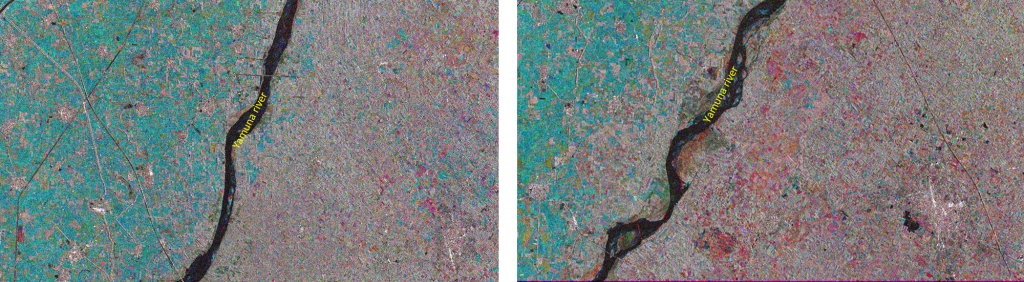
Figure – 2a & b Parts of Haryana & UP in multi-temporal data 12th July, 29th August and 10th September 2026 as RGB, C-3 crops (cyan tone) are widespread in the left side of the river in Yamunanagar and surrounding while C-4 crops(pinkish tone) are widespread and found in the Saharanpur and surrounding region.
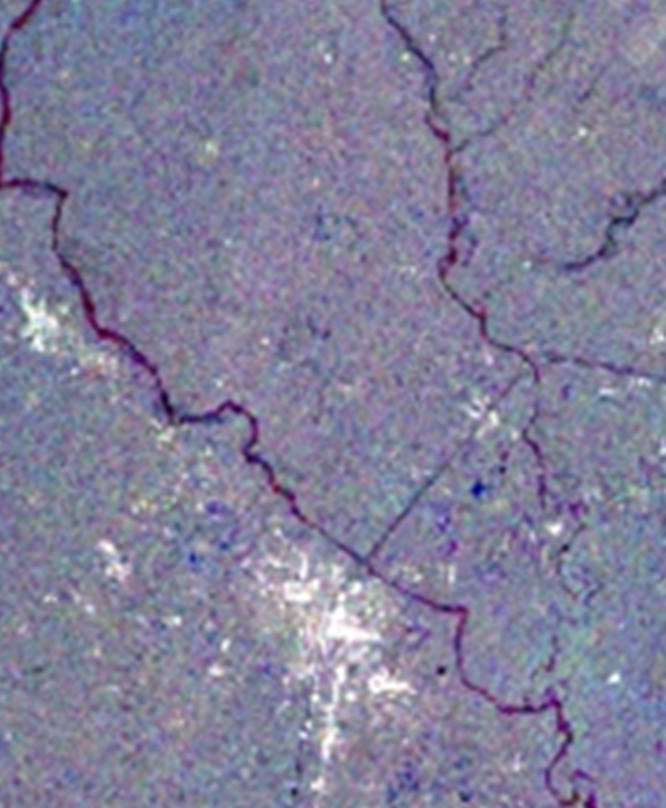
Figure 3 – Parts of Haryana & UP in multi-temporal data 15 July, 1st August and 25th September from Sentinel-1A as RGB
The clear demarcation of the crop’s spatial distribution is brought out in the study, the water management system, irrigation networks and farmer’s need based preference govern this crop distribution which is C3 vs. C4. The C4 crops being climate resilient will find necessary place and preference in Government initiatives in expanding Crop diversification under UN sustainable Agriculture for no poverty and zero hunger initiatives in hotter and drier Agri-ecosystems globally.
References:
Initial results using RISAT-1 C-band SAR data. Manab Chakraborty, Sushma Panigrahy, A. S. Rajawat, Raj Kumar,T. V. R. Murthy, Dipanwita Haldar, Abhisek Chakraborty, Tanumi Kumar, Sneha Rode, Hrishikesh Kumar, Manik Mahapatra and Sanchayita Kundu. Current Science Vol. 104, No.4, Feb, 2013.
Machine learning techniques for phenology assessment of sugarcane using conjunctive SAR and optical data. Md Yeasin, Dipanwita Haldar, Suresh Kumar, Ranjit Kumar Paul, Sonaka Ghosh (2022). Remote Sens.2022, 14(14), 3249;https://doi.org/10.3390/rs14143249
Bimal K. Bhattacharya, V. M. Chowdary , Ayan Das , Mukesh Kumar , Srikanth Poloju , Mamta Kumari , Abhishek Chakraborty , Dipanwita Haldar and Saroj Maity. Inventory and mapping of kharif crops using machine learning with EOS-04 time-series SAR data. Current Science. SPECIAL SECTION: OBSERVATIONS USING EOS-04, May 2024.