Monitoring snow cover variability is crucial for understanding water resources and climate impacts, as excessive snowfall, increases risks, while early melting disrupts river flows, necessitating continuous satellite observations for effective water management.
Praveen Thakur and Sakshi Tripathi
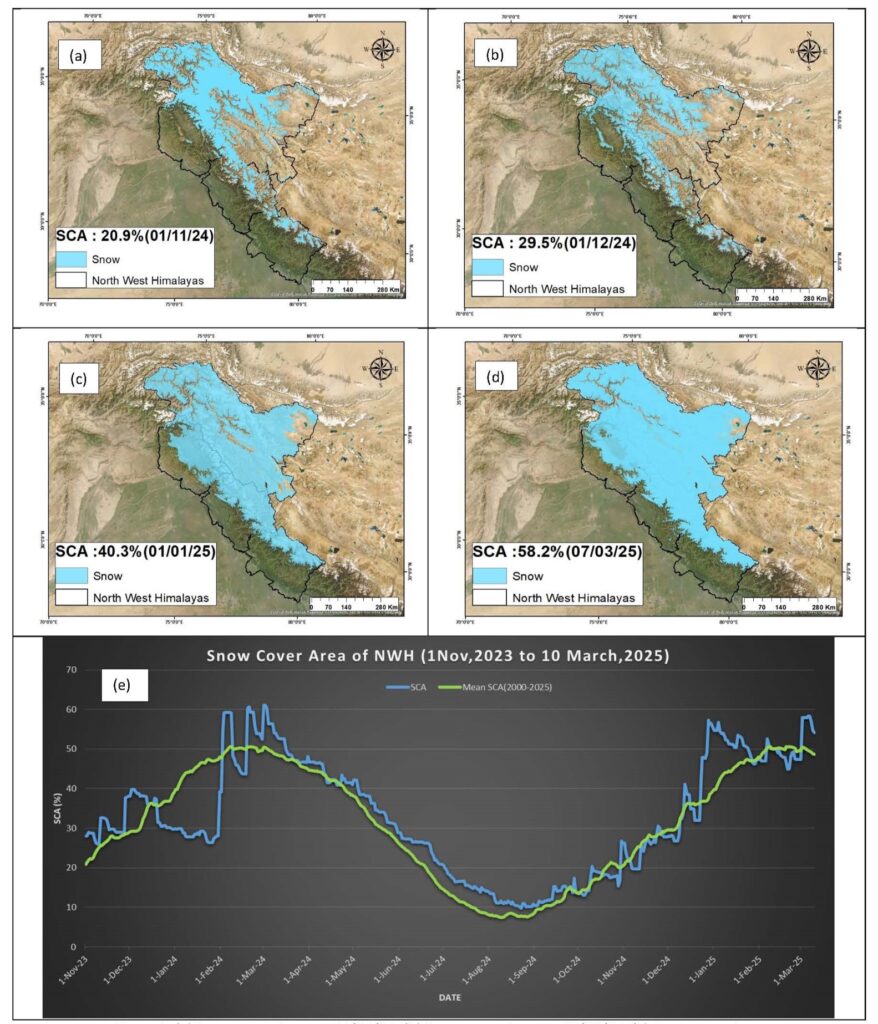
Snow cover in the Northwest Himalaya undergoes significant seasonal changes, impacting water availability, climate, and ecological balance. IIRS has generated a daily SCA mean from 2000 to 2024 using AWiFS, MODIS and IMS datasets. Recent satellite observations from November 2023 to March 2025 reveal a distinct pattern where snow cover steadily expanded during early winter, peaked between late February and early March, and then gradually recedes with rising air temperatures (Figure.1(e)).
The satellite-derived data show that on November 1, 2024 (Figure. 1(a)), snow cover stood at 20.9% of area of NWH, marking the onset of winter. By December 1, 2024, it increased to 29.5% (Figure. 1(b)), reflecting early accumulation, and continued to rise to 40.3%by January 1, 2025(Figure. 1(c)), indicating intensified snowfall. The snow cover peaked 58.2%on March 7, 2025, (Figure. 1(d)) suggesting persistent snowfall in the late winter season. From December 2024 to March 2025, the Snow-Covered Area (SCA) remained above average compared to the long-term records from 2000 to 2025. Despite this increase, there was a significant gap in snowfall events during the period. Major snowfall events were recorded on December 7-11, December 21-24, December 27-28, January 3, January 15-22, February 1-5, and February 28 to March 3, 2025, with no precipitation or dry spells between these events ranging from approximately 5 to 15 days. According to IMD reports, cumulative rainfall data from January 1, 2025, to March 11, 2025, highlighted regional disparities in precipitation. Jammu & Kashmir experienced a snowfall deficit of -59% to -20%, while Ladakh received excess snowfall large excess exceeding 60%. Himachal Pradesh recorded above-normal rainfall in the range of 20% to 59%, whereas Uttarakhand observed a large excess of more than 60%. Earlier in the season, all these regions faced significant rainfall deficits, but snowfall of Early January to early March, changed the trend toward excessive precipitation. Some periods saw higher-than-average snowfall, leading to sharp increases in SCA, while prolonged dry spells caused sustained melting.

Figure 1. (a) Snow cover Area on 01/11/24, (b) Snow cover Area on 01/12/24, (c) Snow cover Area on 01/01/25, (d) Snow cover Area on 07/03/25, (e) Long term SCA analysis graph
Monitoring snow cover variability is vital for understanding water resource availability and climate impacts. Excessive snowfall may elevate avalanche risks, as witnessed during 28 Feb 2025 Mana snow avalanche, while early melting can disrupt river flows, affecting downstream agriculture and hydropower. The observed strong winter snowfall suggests potential impacts on water availability in the coming months. Continuous satellite monitoring remains essential for assessing these patterns and planning water resource management strategies effectively.


No Comments