

Abhishek Danodia and N.R. Patel
Water availability shows the existence of life, so if there is water, there is life. Around 97 percent of the total water available in the oceans while only 3 percent of water is the fresh water, which can be used for drinking, agriculture and industries. In India, about 68 percent of cultivable area comes under rainfed agriculture. Remaining cultivable area has the irrigation facility. Therefore, the need of meeting water demand in the agricultural sector is a top priority to sustain crop production and achieve food security.
An accurate assessment of evapotranspiration (ET) is quite useful in various aspects of water management such as crop water requirement, irrigation scheduling, water budgeting, monitoring of water stress/drought and water productivity. By using remote sensing system, crop evapotranspiration (ETc), water productivity (WP) and water use efficiency (WUE) can be accurately estimate in large areas and help irrigation planners to decide on irrigation water requirement as well as water allocation for optimal crop production.
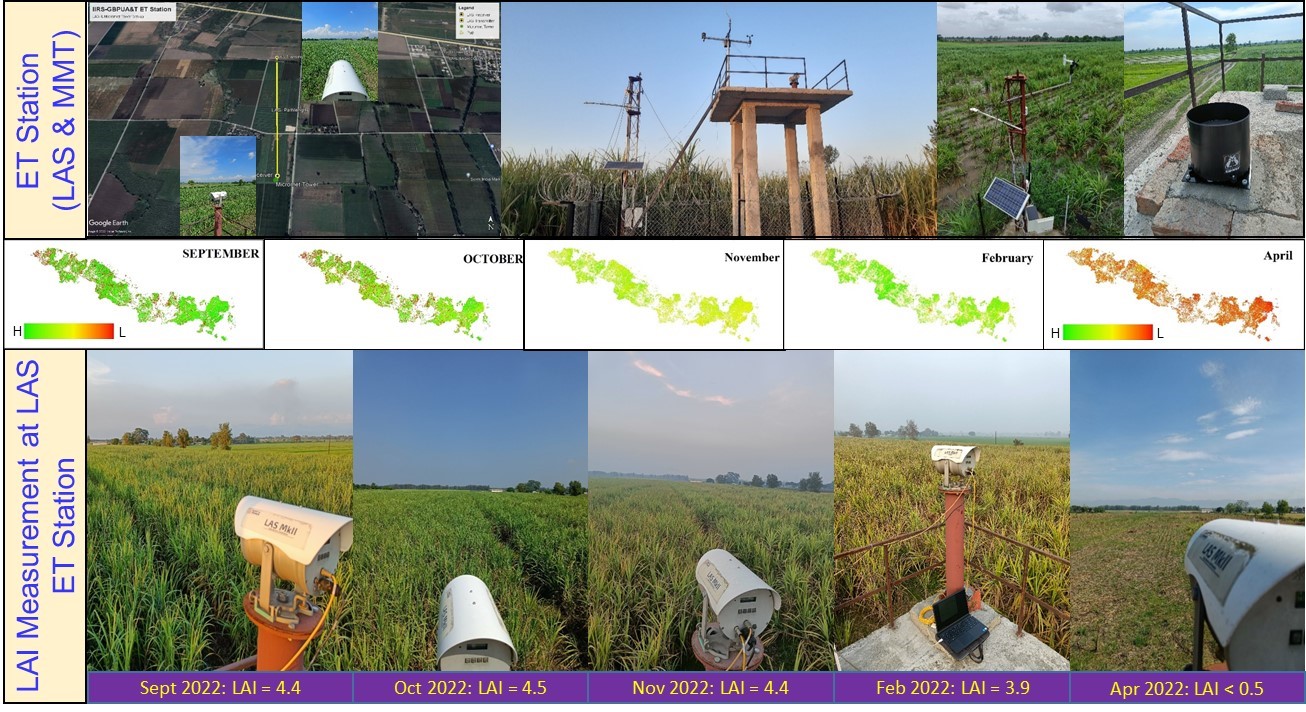
With the key note of ‘Per Drop More Crop’ from Pradhan Mantri Krishi Sinchayee Yojna (PMKSY), the precise assessment of water requirement and effective utilization of water is the prime mandate in context of recent sustainable agricultural production. IIRS-ISRO is also doing comparable research in the agricultural water management to estimate and evaluate the ETc and WP maps at the fine spatial resolution using geospatial technology, in-situ observations and sophisticated instrumentations i.e. Large Aperture Scintillometer (LAS), Eddy Covariance (EC) system and Micrometeorological Tower (MMT) at field scale computation. The LAS based ET station was augmented at GBPUA&T, Pantnagar for continuous ET measurement, which can be used in the surface energy balance studies and remote sensing energy balance model validation. The observation of evapotranspiration is stored in data logger at 5 min interval for the sugarcane field along its path length. Since October 2021 to 2024, the surface energy fluxes are observing constantly, where the yearly crop evapotranspiration was 1500 mm approximately for 2023. This observation was also used in validation of remote sensing energy balance model named METRIC ET model for 2022-23 and 2023-24. Figure 2 illustrate the crop growth variable in scale of observed leaf area index (LAI) values at different season time while corresponding ET maps also represent the ET variability at monthly scale in 2022-23 season.

Schematic representation of the evapotranspiration measurement using Scintillometry and RSEB Model based estimation at the Pantnagar region
Information on degree of water stress, ET and WUE at high resolution from combination of drone images and proximal sensors (optical/thermal) may provide crucial water management decisions and implementation of policy on water saving practices (e.g. micro-irrigation systems) as well as identifying genotypic /phenotypic traits to screen crop varieties tolerant to water stress and higher productivity.
References:
Danodia, A., Patel, N.R., Sehgal, V.K., & Singh, R.P. (2024). Surface energy fluxes and energy balance closure using large aperture scintillometer-based ET station on heterogeneous agricultural landscape in North India. Journal of Agrometeorology, 26(1), 18-24.
Danodia, A., Patel, N. R., Chol, C. W., Nikam, B. R., & Sehgal, V. K. (2019). Application of S-SEBI model for crop evapotranspiration using Landsat-8 data over parts of North India. Geocarto international, 34(1), 114-131.
Patel, N. R., Bhattacharjee, B., Mohammed, A. J., Tanupriya, B., & Saha, S. K. (2006). Remote sensing of regional yield assessment of wheat in Haryana, India. International Journal of Remote Sensing, 27(19), 4071-4090.