Uttarakhand experienced a noticeable escalation in forest fire activity during the first four months of 2026. Fire occurrence remained relatively moderate in January, with 200 MODIS active-fire detections recorded across the state. Activity then declined to 113 detections in February, representing a 43.5% decrease, likely due to the influence of residual winter moisture and comparatively lower fuel flammability. As temperatures increased and vegetation progressively dried, fire activity intensified during March and April, when 178 and 207 detections were recorded, respectively. This upward trend reflects the transition toward increasingly dry and fire-prone conditions characteristic of the pre-monsoon season.
The most dramatic increase occurred in May, when detections rose to 433, representing a 109% increase relative to April and more than double the number recorded in the previous month. May alone accounted for approximately 38% of all detections recorded between January and May, highlighting the late pre-monsoon period as the most critical phase of the fire season. The abrupt rise in fire activity suggests a rapid shift from scattered localised incidents to widespread burning across multiple districts.
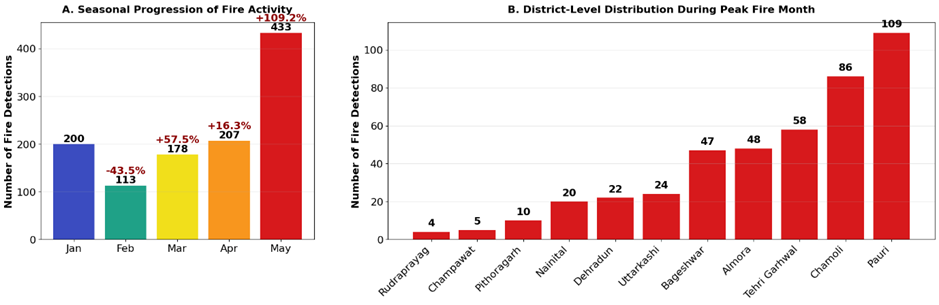
Figure 1 (A) Seasonal progression of fire activity across Uttarakhand during January-May 2026 & (B) District level of fire detections in May, 2026 (Source: FIRMS, NASA)
Spatially, fire activity was concentrated within the mid-elevation forested belt of Uttarakhand, with the highest density of detections occurring across the central Garhwal region. Pauri Garhwal recorded the highest cumulative number of MODIS active-fire detections during the study period (207), followed by Chamoli (190) and Tehri Garhwal (130). A similar spatial pattern was observed during May, the peak month of fire activity, when Pauri Garhwal registered 109 detections, followed by Chamoli (86), Tehri Garhwal (58), Almora (48), and Bageshwar (47). In contrast, substantially lower detection counts were recorded in districts such as Pithoragarh (10), Champawat (5), and Rudraprayag (4). The increase in monthly fire detections and their expanding spatial extent indicate a strong seasonal control on forest fire occurrence in Uttarakhand. As fuel dryness intensified during the pre-monsoon period, fires became both more frequent and widespread, culminating in extensive burning during May immediately before the onset of the southwest monsoon. This pattern highlights the late pre-monsoon season as the period of highest fire risk across the state.
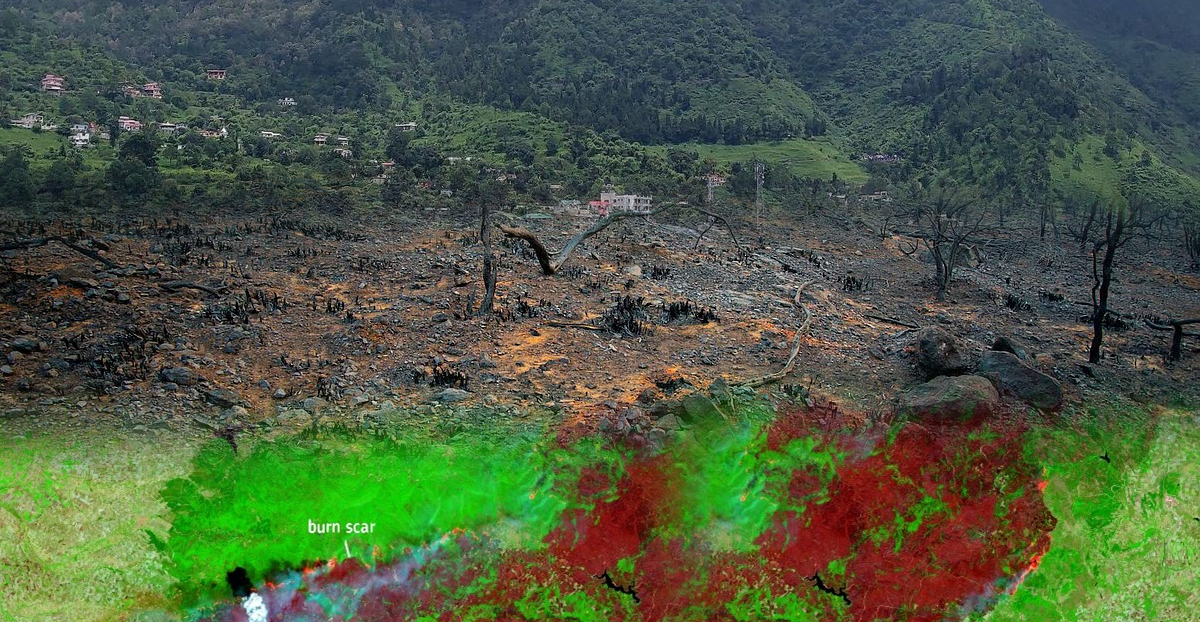
As illustrated in Figure 3, burn severity in Pauri Garhwal, the worst-affected district, was mapped using the differenced Normalized Burn Ratio (dNBR) derived from Sentinel-2 imagery. The assessment was conducted by comparing a pre-fire composite from April 2026 with a post-fire composite acquired between 25 and 28 May 2026, identifying approximately 838.66 km² of burned area. Figure 4 further depicts the progression of the fire using Sentinel-2 Shortwave Infrared (SWIR) imagery between 20 and 25 May 2026. The sequence clearly shows the expansion of active fire fronts and the increasing extent of burn scars over time, highlighting the rapid spread of fire during the peak phase of the fire season.
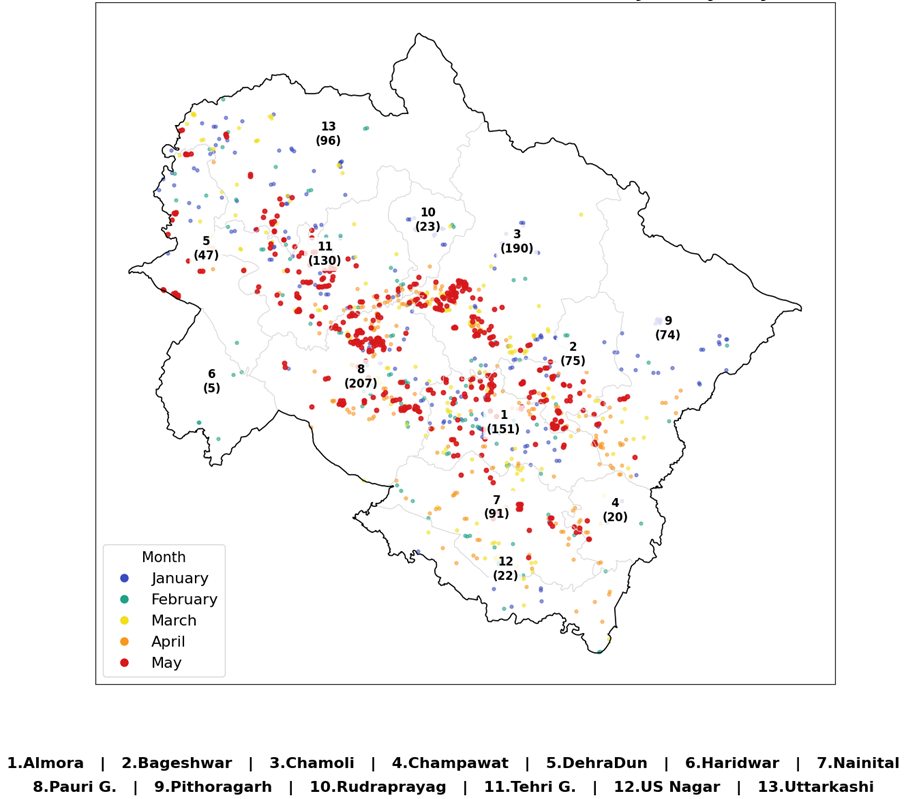
Figure 2. Monthly evolution of MODIS active fire detections across Uttarakhand during January-May 2026
The burn severity distribution indicates that most of the affected area experienced relatively low ecological impact. Low-severity burns accounted for 686.05 km² (81.8%) of the total burned area, while 137.62 km² (16.4%) was classified as moderate-low severity. In contrast, moderate-high severity burns covered only 14.05 km² (1.7%), and the highest severity class occupied just 0.94 km² (0.1%) of the landscape. These findings suggest that although the extent of burning was substantial, the ecological impacts were predominantly concentrated within the lower burn-severity categories, consistent with the surface-fire characteristics commonly observed in chir-pine dominated forests of the Western Himalaya. The spatial pattern of burn severity further supports this interpretation. Areas of moderate-high and high severity were confined to relatively small patches, while low-severity burning was distributed across much of the affected landscape. The northern and north-central portions of the district exhibited the highest concentration of severe burns, corresponding closely with the clusters of MODIS active-fire detections recorded during May. This agreement between active-fire observations and satellite-derived severity estimates increases confidence in the overall assessment.
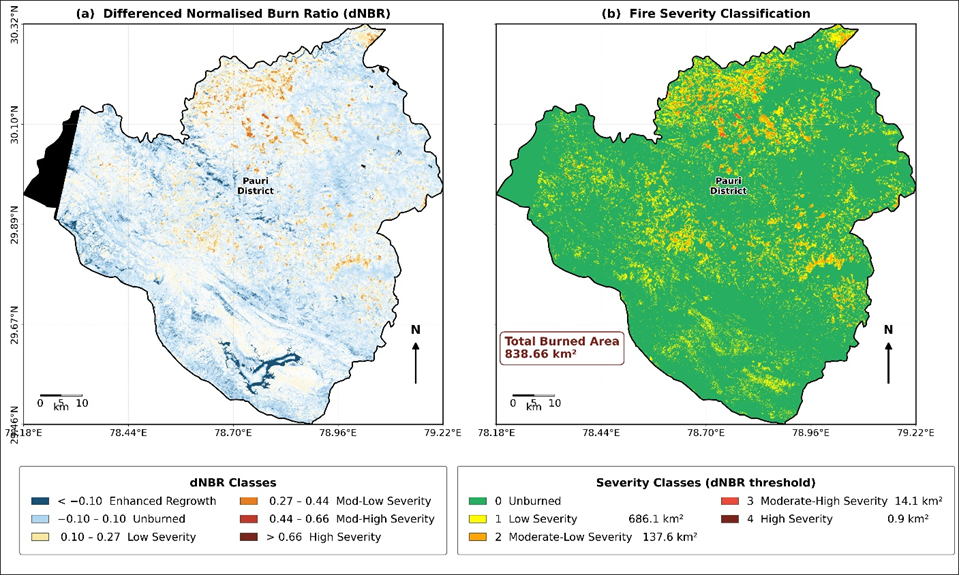
Figure 3. Fire severity assessment for Pauri District using Sentinel-2 dNBR
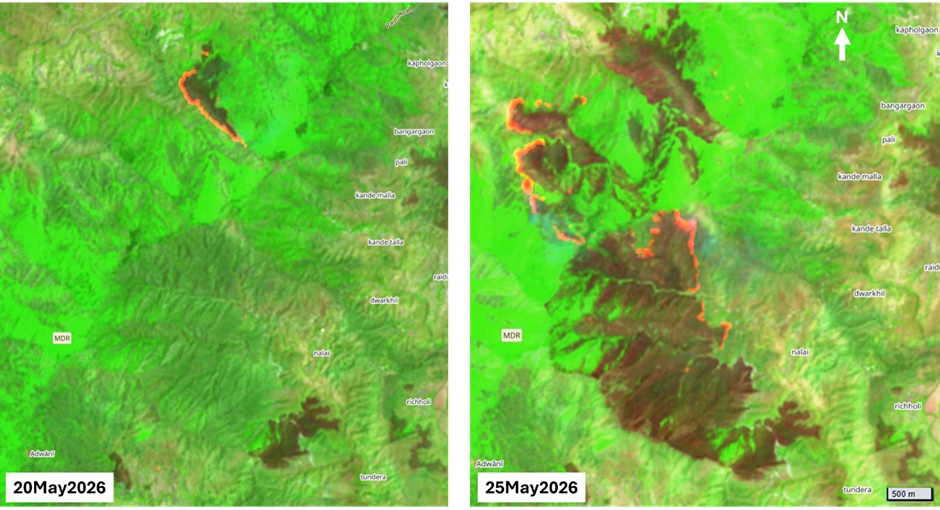
Figure 4. Fire progression observed using SWIR band of Sentinel-2 near Nalai (Pauri)
Bibliography :
White, J. D., Ryan, K. C., Key, C. C., & Running, S. W. (1996). Remote sensing of forest fire severity and vegetation recovery. International Journal of Wildland Fire, 6(3), 125-136.
Key, C. H., & Benson, N. C. (2006). Landscape assessment (LA). In: Lutes, Duncan C.; Keane, Robert E.; Caratti, John F.; Key, Carl H.; Benson, Nathan C.; Sutherland, Steve; Gangi, Larry J. 2006. FIREMON: Fire effects monitoring and inventory system. Gen. Tech. Rep. RMRS-GTR-164-CD. Fort Collins, CO: US Department of Agriculture, Forest Service, Rocky Mountain Research Station. p. LA-1-55, 164.
Ankita Tiwari
June 14, 2026Very excellent experience